
How to Set Up the GainzAlgo Trading Indicator on TradingView
A clean chart with clear entries always beats a screen full of guesswork. That is why so many traders now add a signal tool to TradingView instead of drawing every level by hand.
However, a good tool only helps when you install it correctly. A rushed setup leads to missed alerts, cluttered charts, and signals you simply do not trust.
I have spent more than twenty years writing about trading platforms and testing chart tools alongside real traders. In that time, I have watched the same small setup mistakes cost people a lot of clarity. So this guide walks you through the entire process, one step at a time.
By the end, you will know how to install, configure, and save the GainzAlgo trading indicator on TradingView with confidence.
What Is the GainzAlgo Indicator?
Let us start with the basics, because the answer shapes every choice that follows. So, what is the GainzAlgo indicator? In plain terms, it is a signal-based script that sits directly on your TradingView price chart.
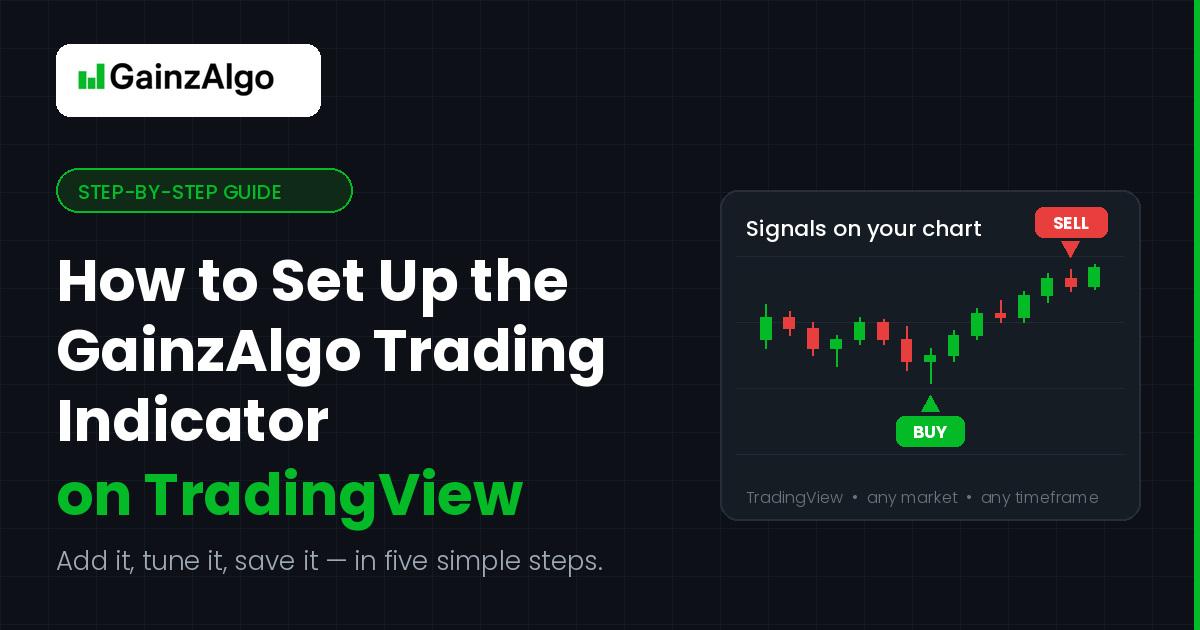
Instead of asking you to read four oscillators at once, it studies price behaviour and prints simple labels on the candles. A buy label suggests a possible long setup. A sell label suggests a possible short setup.
Because the logic runs on the chart itself, you do not need extra software or a second monitor. You just open TradingView, load the script, and read what appears.
Of course, no indicator predicts the future. It highlights conditions that have mattered before, and then you decide what to do next. That distinction matters, and I will return to it later.
GainzAlgo Indicator Overview: What Lands on Your Chart
Before you touch a single setting, here is a short GainzAlgo indicator overview so you know what to expect.
- On-chart signals. Buy and sell labels print near the relevant candles, so you read direction at a glance.
- Market flexibility. The script runs on forex pairs, crypto, indices, and individual stocks.
- Timeframe freedom. You can load it on a one-minute chart or a daily chart, then compare the two.
- Adjustable inputs. Sensitivity, label style, and filters usually sit in the settings panel.
- Alert support. TradingView can ping your phone or email when a fresh signal appears.
In short, the tool aims to reduce screen time rather than add to it. Nevertheless, the setup still deserves ten focused minutes.
Three Things to Check Before Setup
First, make sure you hold an active TradingView account. A free plan works fine for testing, although it limits you to a small number of indicators per chart. Paid plans allow more scripts at once, which helps if you also run moving averages or volume tools.
Second, confirm your access to the script itself. Premium tools like this one usually arrive as invite-only scripts, so someone must grant permission to your exact username.
Third, double-check that username. Traders often sign up with one email and then request access under a slightly different handle. As a result, the script never appears in their list, and they assume the tool is broken.
How to Set Up the GainzAlgo Trading Indicator on TradingView
Now for the main event. Follow these steps in order, because each one builds on the last.
Step 1: Log In and Open a Clean Chart
Sign in to TradingView and open the chart panel. Next, pick the market you actually trade rather than a random symbol.
Then remove anything you do not need. Old trendlines, unused oscillators, and stray notes all compete for attention. A tidy chart makes new signals far easier to spot.
Step 2: Open the Indicators Menu
Look at the toolbar above your chart. Click the Indicators button, which usually sits near the timeframe selector and the chart-type icon.
A search window will open. This window holds every built-in study, every community script, and every private tool linked to your account.
Step 3: Find the Script Under Invite-Only Scripts
Inside that window, look down the left-hand menu. Click Invite-Only Scripts, since premium tools live there rather than in the public library.
Your approved script should appear in that list. If it does not, close the window and refresh the page once. Sometimes permissions need a moment to sync.
Alternatively, type the script name into the search bar. The matching result will show a small lock icon beside it, which confirms the private access.
Step 4: Add the Indicator to Your Chart
Click the script name once. TradingView will load it instantly, and the labels will begin to plot across your candles.
At this point, scroll back through recent history. You want to see how the signals behaved during quiet ranges as well as strong trends. This quick visual check builds real familiarity before any money moves.
Step 5: Adjust the Input Settings
Hover over the indicator name on your chart, then click the small gear icon. The settings panel will open with two tabs, usually Inputs and Style.
Start with sensitivity. A higher setting produces more signals, which suits scalpers on short timeframes. A lower setting produces fewer signals, which suits swing traders who prefer patience.
Next, look for any built-in filters. Some scripts let you mute signals during ranging conditions, which cuts a lot of noise on lower timeframes.
Change one input at a time. Then watch how the chart reacts before you touch the next value. Traders who alter five settings at once never learn which change actually helped.
Also write your chosen values somewhere safe. A short note in your trading journal saves real effort if you ever switch devices.
Step 6: Style the Labels for Instant Clarity
Now move to the Style tab. Here you control colours, label size, and visibility.
Choose colours that contrast strongly with your chart background. For example, bright green and bright red work well on a dark theme, while deeper shades suit a light theme.
Additionally, hide any plot you never use. Fewer objects mean faster decisions during a live session.
Step 7: Create Alerts So the Chart Watches for You
This step changes everything about your routine. Right-click on the chart, then select Add Alert. In the condition dropdown, choose the indicator instead of the price.
Pick the specific signal you want to track. After that, select your delivery method, such as a push notification, an email, or a pop-up.
One more detail deserves attention. Set the alert to trigger Once Per Bar Close rather than on every tick. Consequently, you avoid false pings from candles that flip direction before they finish forming.
Step 8: Save Your Layout as a Template
Finally, protect your work. Click the layout name in the top-right corner, then choose Save.
You can also open the indicator template menu and save your exact configuration. Later, you apply that same template to any new symbol in two clicks.
Skipping this step is the most frustrating mistake of all. Traders spend twenty minutes tuning inputs, close the tab, and then start again from scratch the next morning.
How to Get Smarter Signals with GainzAlgo
Installation is only half the job. The best traders treat any signal tool as one input among several. So here are four habits that help you get smarter signals with GainzAlgo.
Add a trend filter. Load a 200-period moving average on the same chart. Then favour buy signals above that line and sell signals below it. This one filter removes plenty of low-quality setups.
Check a higher timeframe. Suppose a buy label appears on the 15-minute chart. Open the four-hour chart and confirm that the wider structure agrees. When both align, the setup carries more weight.
Respect the session clock. Spreads widen and volatility dries up during quiet hours. Therefore, many traders only act on signals during major market sessions.
Fix your risk first. Decide your stop loss and position size before the signal arrives, not afterwards. Signals suggest direction, yet risk management protects the account.
Common Setup Problems and Quick Fixes
Even careful traders hit small snags. Fortunately, most of them have simple answers.
The script never appears. Your username probably differs from the one on the access list. Check the spelling, then request a fix.
You cannot add another indicator. Your plan limit is full. Remove an unused study, or upgrade the account.
Signals feel too frequent. Lower the sensitivity and move to a higher timeframe. Noise usually shrinks straight away.
Alerts stay silent. Open your TradingView notification settings, and allow alerts in your browser or mobile app as well.
Labels seem to shift. Wait for the candle to close before you judge any signal. Live candles change constantly, so patience solves most of this confusion.
Test the Setup Before You Risk Real Money
Here is the part that separates disciplined traders from hopeful ones. Never trade a new tool live on day one.
Instead, use TradingView's Bar Replay feature. Rewind the chart, step through the candles, and watch each signal form in real time. This exercise teaches you how the tool behaves in trends, ranges, and news spikes.
After that, run a demo account for a few weeks. Log every signal you take, along with your reasoning and the outcome. Thirty entries will tell you far more than thirty hours of reading.
Remember that no indicator wins every trade. Markets shift, conditions change, and losing streaks happen to everyone. Treat trading like any other business — one where testing, record-keeping, and risk control matter more than any single decision. So treat the tool as a decision aid and keep your risk small. Then judge your results across a large sample instead of a single session, the same way you'd evaluate any business by its performance over months, not by one good or bad day.
Quick Answers to Common Questions
Does it work on a free TradingView plan? Yes, although you can only run a limited number of indicators at once.
Can I use it on mobile? Yes. Save your layout on desktop first, then open the same layout in the mobile app.
Which timeframe suits it best? That depends on your style. Scalpers often prefer five-minute charts, while swing traders lean towards four-hour or daily charts.
Do I need to code anything? Not at all. The whole setup happens through menus and simple toggles.
Can I run it with other indicators? Yes, and many traders do. Volume tools and moving averages pair with it especially well.
How many alerts should I create? Start with one or two per market. Too many notifications simply train you to ignore your phone.
Final Thoughts
Setting up a signal tool takes minutes, yet the habits around it shape your results for years. Open a clean chart, load the script, tune one input at a time, and save the layout. Then test everything in replay mode before you commit real capital.

 Arabic
 French
 Spanish
 Portuguese
 Deutsch
 Turkish
 Dutch
Dutch
 Italiano
 Russian
 Romaian
 Portuguese (Brazil)
 Greek
Greek